
Practicing at vRad
Remote radiologist jobs with flexible schedules, equitable pay, and the most advanced reading platform. Discover teleradiology at vRad.
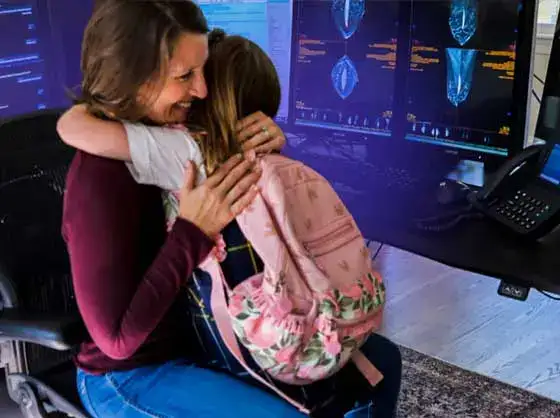
Remote radiologist jobs with flexible schedules, equitable pay, and the most advanced reading platform. Discover teleradiology at vRad.

Radiologist well-being matters. Explore how vRad takes action to prevent burnout with expert-led, confidential support through our partnership with VITAL WorkLife. Helping radiologists thrive.

Visit the vRad blog for radiologist experiences at vRad, career resources, and more.
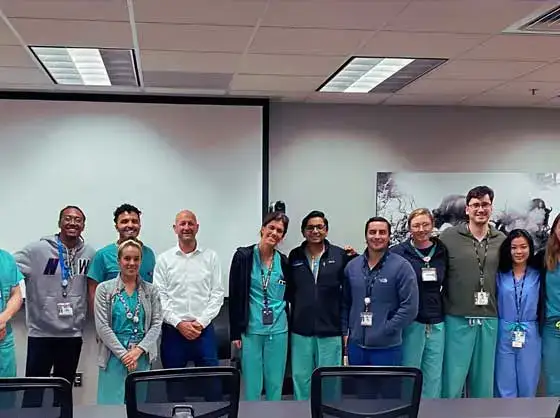
vRad provides radiology residents and fellows with free radiology education resources for ABR boards, noon lectures, and CME.
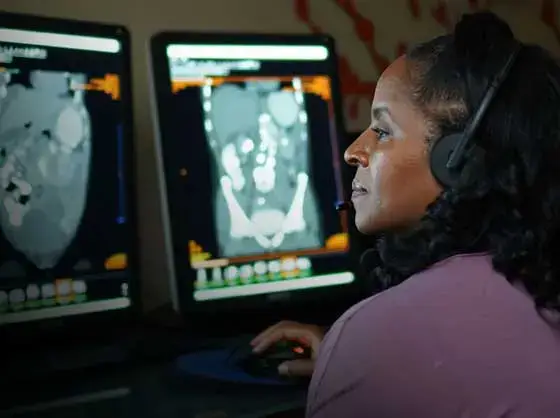
Teleradiology services leader since 2001. See how vRad AI is helping deliver faster, higher-quality care for 50,000+ critical patients each year.
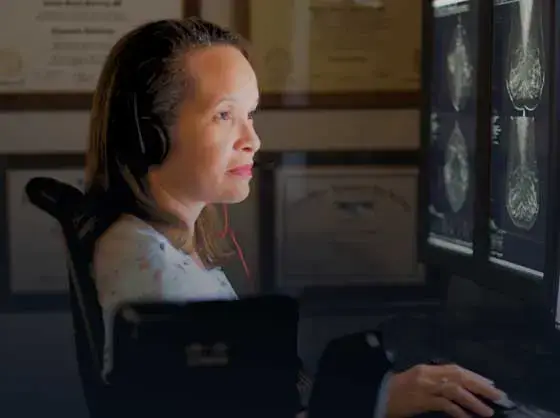
Subspecialist care for the women in your community. 48-hour screenings. 1-hour diagnostics. Comprehensive compliance and inspection support.
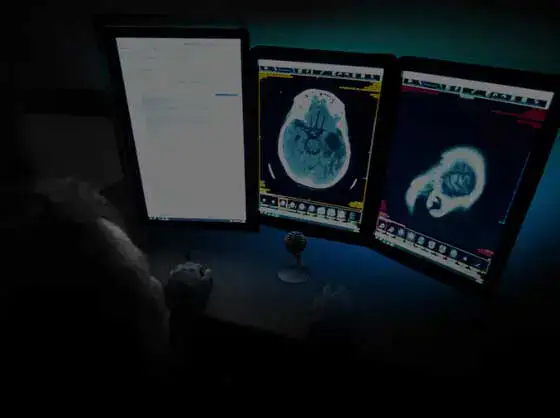
vRad’s stroke protocol auto-assigns stroke cases to the top of all available radiologists’ worklists, with requirements to be read next.

vRad’s unique teleradiology workflow for trauma studies delivers consistently fast turnaround times—even during periods of high volume.
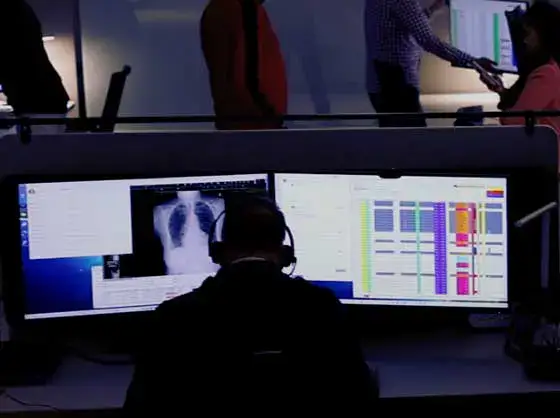
vRad’s Operations Center is the central hub that ensures imaging studies and communications are handled efficiently and swiftly.
vRad is delivering faster radiology turnaround times for 40,000+ critical patients annually, using four unique strategies, including AI.

vRad is developing and using AI to improve radiology quality assurance and reduce medical malpractice risk.
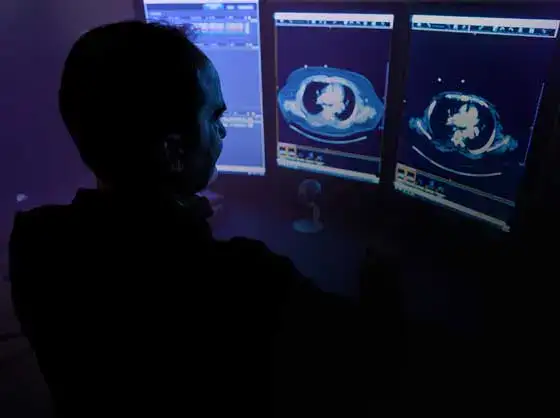
Designed by radiologists and proven over 20+ years. Every facility in one workflow with native AI, real-time analytics, and 24/7 support.

The vRad Operations Center provides live, U.S.-based clinical and technical support around the clock, so radiologists keep their eyes on images.

Switch platforms without stopping the practice. vRad has run PACS, EMR, and HL7 integrations since 2001, stage by stage.
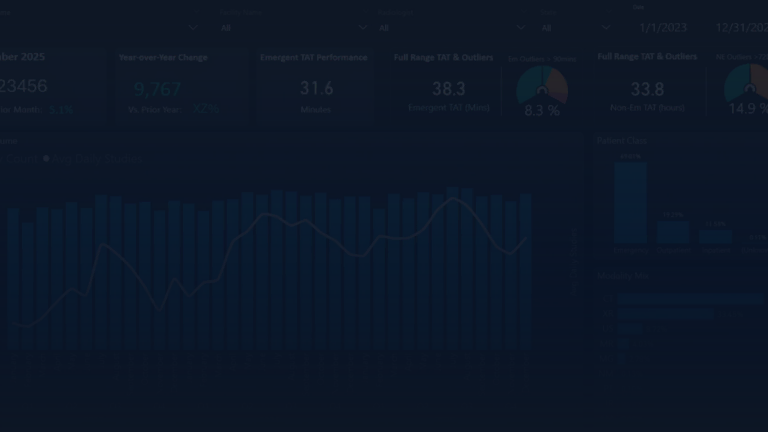
See turnaround times, volume, radiologist productivity, and referral trends from every facility on one real-time dashboard.

One click opens the case, the header is pre-filled, and dictation in any order becomes a structured report. Reporting software radiologists prefer.

AI built into the workflow, not bolted on: prioritizing the worklist, surfacing priors, formatting reports, drafting impressions, and placing critical findings calls.

One worklist for every facility. Native AI flags potentially critical findings and moves them to the top, cutting turnaround 15+ minutes.
One click opens the case, the header is pre-filled, and dictation in any order becomes a structured report. Reporting software radiologists prefer.

Dictate findings in any order. Native AI organizes them by body region into one consistently structured report, in your own words.

Native AI drafts the impression from the radiologist’s dictated findings. Built into reporting, not bolted on.
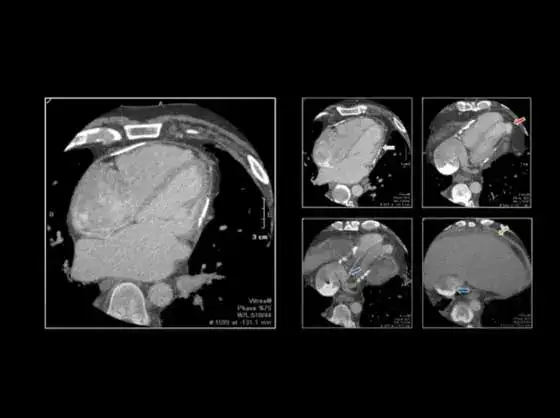
Since 2010, vRad Radiology Education has provided high-quality radiology CME. Open to all radiologists, these 15-minute online modules are a convenient way to stay up to date on practical radiology topics.
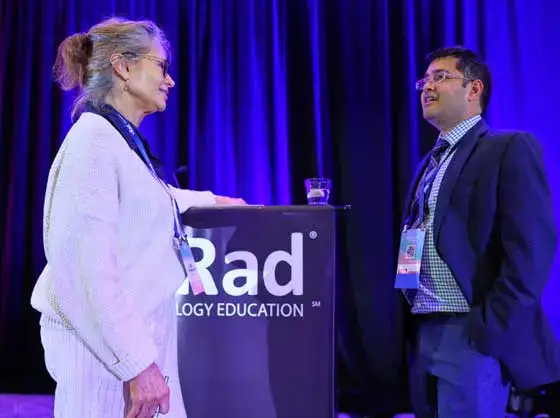
Join vRad’s annual spring CME conference, featuring top speakers and practical radiology topics.
vRad provides radiology residents and fellows with free radiology education resources for ABR boards, noon lectures, and CME.

Academically oriented radiologists love practicing at vRad too. Check out the research published by vRad radiologists and team members.

Learn how vRad revolutionized radiology and has been at the forefront of innovation since 2001.
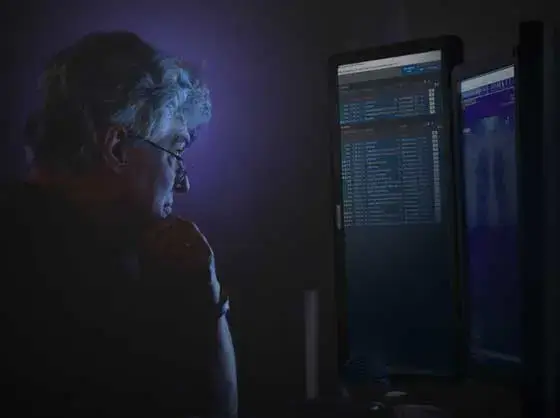
Since developing and launching our first model in 2015, vRad has been at the forefront of AI in radiology.

Explore vRad’s award-winning culture and what it’s like to work at vRad.

Meet vRad’s executive and medical leaders.
Visit the vRad blog for radiologist experiences at vRad, career resources, and more.

Get the latest news from vRad and top stories over the years.
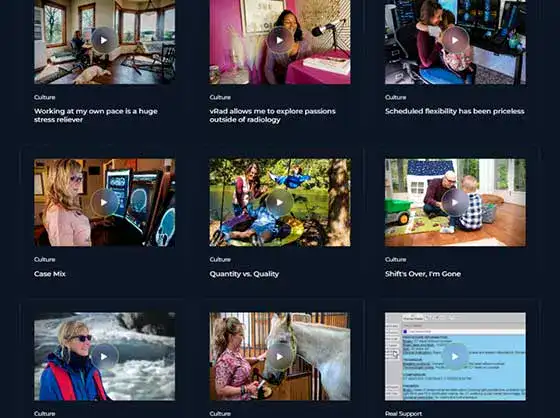
Explore our practice’s reading platform, breast imaging program, AI, and more. Plus, hear from vRad radiologists about what it’s like to practice at vRad.

Ready to be part of something meaningful? Explore team member careers at vRad.
On The vRad Platform, your imaging data is normalized at the point of intake. Turnaround, volume, productivity, and many other key datapoints are ready to explore the moment you need them, not the week after month-end.

Most radiology practices aren’t short on data. They’re drowning in it. And it’s often spread across unconnected systems in formats that don’t line up. What’s missing is a single source of truth.
The vRad Platform standardizes your imaging data at the point of intake, from every facility and every radiologist, whether the study was read remotely or on-site. Instead of spending hours each month reconciling reports, instantly see what’s happening across the practice.

Adopting AI is one step. Reporting on its benefit is the next. The AI Insights dashboard shows how many exams native AI moved up the worklist, what share of critical findings those exams accounted for, and how much faster those reports were signed compared to the practice average. Drill in by modality, emergent status, or patient age.

View client demand against radiologist capacity, hour by hour across all 24 hours. Break down any day by urgency, patient class, modality, or TAT, or switch to the full month to spot service-level dips. See exactly which hours were over- or understaffed, then plan next month’s schedule, or your next hire, from actual performance data.

Case counts and RVUs tell you how much each radiologist read. The Case Workflow dashboard shows how they read: how often cases are skipped, released, transferred, sent for consult, or pulled back by the system when a radiologist steps away. Compare to the practice average. See which procedures get skipped and which get picked instead, then check whether a follow-up conversation changed the pattern.

Standardize procedure names, CPT mappings, and billable report content across all facilities to enable accurate RVU capture, consistent coding, and reduced billing leakage.

Use historical volume by modality, location, hour, and day to project demand, staffing, and scheduling.

Compare TAT across sites, radiologists, and modalities. Separate emergent from non-emergent so outliers are visible by the hour.

See reading performance by radiologist or for the entire practice. Track RVUs, find bottlenecks, and see where capacity is going unused.

Protect client retention and avoid penalties by monitoring threshold performance. Report STAT and routine delivery, with the percentage of studies over threshold reported alongside the count.

Analyze report time, volume, procedure mix, and performance data from every site in one view, with the same definitions applied everywhere.

Identify and document demoralizing behaviors like case skipping and cherry picking so conversations are grounded in data.

Measure the impact of your AI investment. Differentiate your practice with referrers by reporting on how native AI on The vRad Platform is improving patient care, such as faster turnaround for patients with critical findings.

Watch Joe Schmugge, vRad COO, and Benjamin Strong, MD, vRad CMO, as they pull back the curtain on how vRad Analytics works and some of the new insights radiology leaders have at their fingertips in the new vRad Platform dashboards.
A radiology practice should track these five core metrics at a minimum: turnaround time by priority (STAT vs. routine), study volume by modality and site, radiologist productivity in RVUs, SLA compliance (the share of studies delivered within threshold), and referring physician order trends. Measured the same way at every site, these five show whether the practice is fast enough, staffed to demand, and growing where it expects to.
Radiology analytics improve turnaround time by showing exactly where delays occur. Hour-by-hour views of demand against reading capacity reveal which shifts back up, and turnaround by site, modality, and radiologist can separate a staffing gap from a workflow problem. Tracking emergent and non-emergent turnaround separately lets a practice fix the cases that matter most first.
Radiology practices forecast staffing needs by analyzing historical study volume by hour, day, modality, and location, normalized across all facilities so the figures are comparable. That baseline shows expected demand for a shift or a season, which the practice can match to reading capacity before the schedule is set.
Analytics can identify case skipping (passing over cases in the worklist for someone else to read) and cherry picking (selecting easier or higher-value cases out of order). Both are visible within vRad Analytics, and both affect how work is distributed and morale across the practice.
Standardized data is important because a metric is only comparable when it is defined the same way everywhere. When PACS, RIS, and other systems each record a study differently, practice-wide turnaround and productivity figures have to be assembled by hand and are open to dispute. Standardizing data at intake means one definition applies across every facility and radiologist, so dashboards can be trusted without a reconciliation step.
Normalized data improves revenue cycle management by standardizing procedure names, CPT mappings, and billable report content across all facilities before anything reaches coding. With one definition per procedure and reports that consistently carry the content coders need, a practice captures RVUs accurately, codes consistently, and reduces billing leakage from denials, downcodes, and resubmissions.
No. Analytics are built into The vRad Platform on the same shared worklist and standardized data the practice reads on. Dashboards for turnaround, volume, productivity, SLA compliance, reading behaviors, AI impact, and referral trends are available without exporting data to a third-party BI tool or building reports in a spreadsheet.
While Sirona and Intelerad offer workflow reporting and operational visibility, The vRad Platform was built and refined over more than two decades to run one of the largest radiology practices in the United States, processing millions of studies annually. As a result, The vRad Platform’s analytics capabilities are deeply integrated into day-to-day practice operations rather than functioning as a standalone reporting tool.